2,907 views
 Using custom/non-Performance Counter data to build graphs in Operations Manager 2007
It is pretty easy to use data collected by Performance monitors in Counter objects within OpsMgr 2007. You can create graphs, create rules/monitors alerts, etc
But you can do the same with any type of information that can be gathered by e.g. a vbs vbscript
Suppose you want to monitor the number of files in a given folder, and use this in a graph, then this is what you should do :
First, you need to build a script that will return the collected data in a property bag, so you can use it as it is was performance collection data
A basic script to monitor the number of files in a given folder could look like this :
|
Option Explicit Dim oArgs if oArgs.Count < 1 Then If oFso.FolderExists(oArgs(0)) Then Call oBag.AddValue("NrOfFiles",NrOfFiles) |
Graphing custom data
First, we need to set up OpsMgr to run the script on our targets, in such a way that the collected information would become available
In short, this is what we need to do before we can use the data :
– create a PerformanceCollection rule and then create overrides for each of the servers that need to be monitored
– create a performance view to see the data
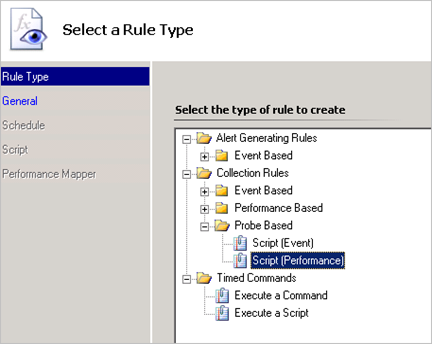
Go to rules, right click and create a Probe based rule, and interpret the results as performance data
Save the rule in a custom management pack and click next to continue
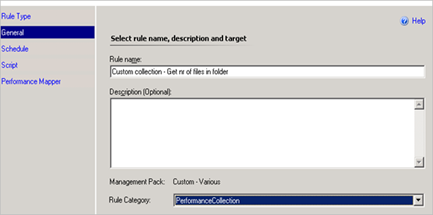
Set a good name, set the target to Windows Operating System, set the category to PerformanceCollection (you will have to scroll up to see the Collection Categories) and leave the rule DISABLED for now
Set the target to a class/group containing Operating System objects
Set the schedule (e.g. 15 minutes)
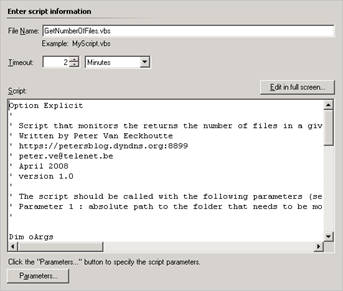
Set a good script name (don’t forget the vbs extension), paste the script from the table above (make sure not to miss any carriage returns)
Set the script timeout
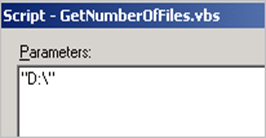
Click the parameters button and enter the path that you want to monitor e.g. "D:\"
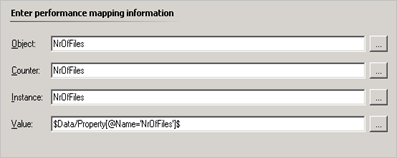
Set the performance mapping information to the variable that is returned by the script
In my example, this is "NrOfFiles"
Create the rule
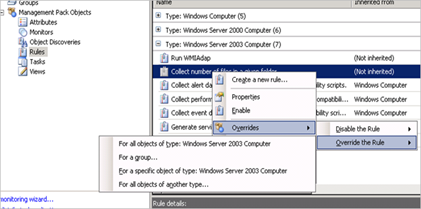
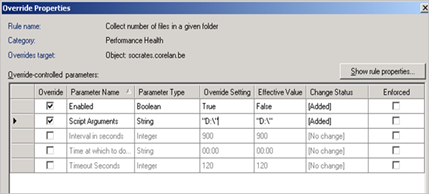
The rule is now disable, so you need to create an override for each server, and set "Enabled" to true for those servers. Additionally, you can specify another path per server by changing the Parameter field
Save the override and wait until the script runs.
Check the Operations Manager eventlogs on the target machine(s) and verify that the script has ran and completed succesfully
If the scrip ran fine, we’ll create a graph to display the results
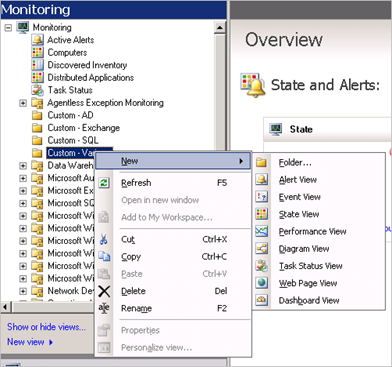
Open the monitoring pane, find the folder that represents your custom management pack
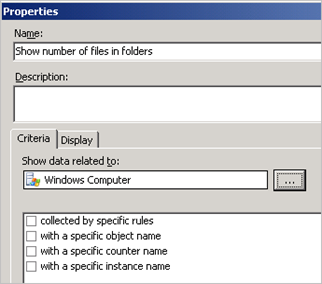
Right click and choose "New > Performance View"
Set a good name
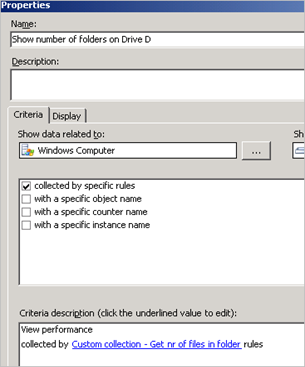
Criteria : Show data related to "Windows 2003 Computer" (select the same group that was used when you’ve created the rule)
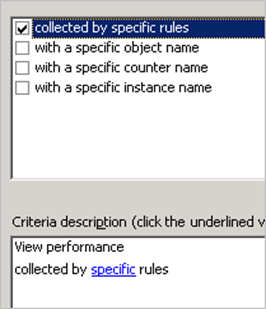
Enable "collected by specific rules"
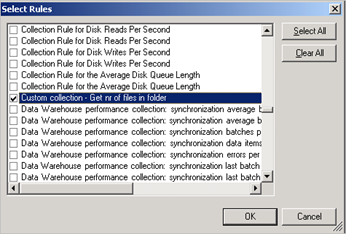
Click the "specific" link under Criteria Description and select the newly created Rule
Save the graph
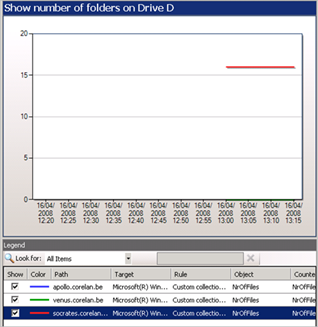
Wait until data starts flowing back to OpsMgr and you should see the performancecollection objects. After enabling the objects you want to see, the graph lines should become visible as well.
Using custom data to create alerts / monitors
You can use the same script to create alerts (using a rule or a monitor) – browse through this blog to find more information on creating monitors based on scripts and use the data from the PropertyBag in the unhealthy or healthy expression builder
© 2008 – 2021, Peter Van Eeckhoutte (corelanc0d3r). All rights reserved.
